Audio Content and Subjective Evaluation
Author: Thomas Sporer
Co-Author: Sascha Dick
EBU Sound Quality Assessment Material (SQAM)
Many of the audio excerpts used in this package are taken from EBU's legendary Sound Quality Assessment Material (SQAM) CD, for details on the content see EBU TECH 3253
Specifically the following excerpts were used (track / index numbers as per EBU TECH 3253):
- Castanets (#27 / 1)
- Glockenspiel (#35 / 2)
- Accordeon (#42 / 1)
- Quartet (#48 / 1)
- English Female Speech (#49 / 1)
- English Male Speech (#50 / 1)
- German Female Speech (#53 / 1)
- German Male Speech (#54 / 1)
We extend our sincere gratitude to EBU for providing this high-quality audio material.
Characterization of Audio Items
This section provides insight on the subjective quality of some of the provided items when assessed by expert listeners according to the standardized MUSHRA listening test methodology. This informs unexperienced listeners about the outcome of a professionally conducted listening test for these items.
For the characterization of most of the audio samples, listening tests were conducted in 2001. The test method was an early version of the ITU-R Recommendation ITU-R BS.1534, nick-named MUSHRA (MUltiple Stimulus with Hidden Reference and Anchors). Since 2001, MUSHRA has been improved in several aspects. Today, MUSHRA is the most frequently used scheme for characterization of audio quality.
MUSHRA
The target of MUSHRA is to perform both a comparative ranking of the quality of different systems and to obtain absolute numbers. A scale ranging from 0 to 100 is used. Five intervals on that scale are labeled "bad", "poor", "fair", "good" and "excellent". The test subjects are given an open (known) reference: This reference defines the expected maximum quality. Pre-defined anchor conditions are used to stabilize the scale.
Several instances produced from the same original audio (the reference) item are presented to a listener in random order. Among these instances there are the predefined conditions "low pass at 7 kHz" and "low pass at 3.5 kHz" as hidden anchors, and the unprocessed original as hidden reference. The test subjects are allowed to switch between all instances and the known unprocessed original (open reference) in any order and as long as they desire. The listeners are asked to compare each instance to the open reference and to each other, and to rank them using the 5 interval quality scale (see Figure 1). Note that the hidden reference is scored by the subjects, too. The subjects are told to score the instance which they belief to be the open reference at top of the scale (=100). However, if there are one or more other instances which are very similar to the unprocessed original, the listeners might choose to give the 100 to the wrong item and a lower score to the hidden reference. Therefore the average score obtained for the hidden reference can drop below 100. Today the ability to detect the hidden reference is used to check the reliability of the subjective scores of a listener: If the listener grades the hidden reference down to less than 90, the data of this listener is deleted from further statistical analysis. This process is called post-screening.
Statistical Analysis
In ITU-R Recommendation ITU-R BS.1534 different alternatives for the statistical analysis are given. In the following only statistical analysis based on the graphical representation of parametric statistics is shown. Parametric statistics is valid if the test results follow a Gaussian distribution. In parametric statistics, for each stimulus the average of scores and their standard deviation is calculated and a so-called 95% confidence interval can be derived. The confidence interval indicates the range in which the average is expected with a probability of 95% when the listening test would be repeated with listeners of similar skill. While the standard deviation is a property of the listener population, the size of the confidence interval scales with the square-root of the number of listeners: If there are four times more listeners participating, the confidence interval is reduced by a factor of two. Figure 2 shows an example of results from a MUSHRA test.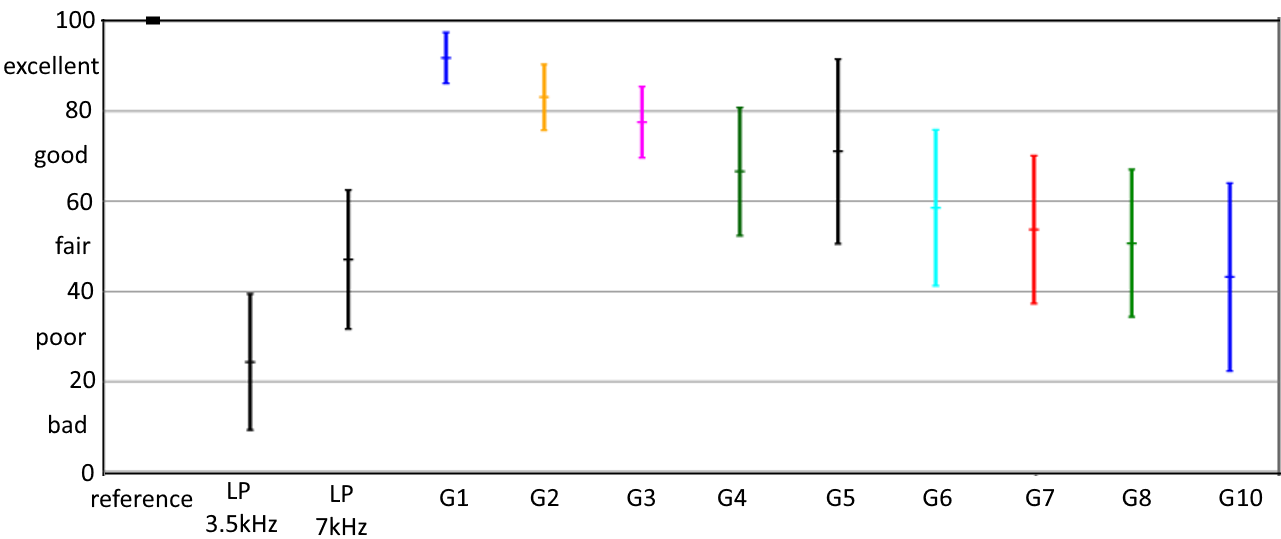
The confidence interval for the (hidden) reference includes the value 100. The lower anchor (3.5 kHz) is at about 25, the mid range anchor at about 50, and 9 different systems (here: different numbers of cascades of the same audio codec G1 ... G10) are in the range from 92 down to 40.
If the assumption "Gaussian distribution of scores" is not valid, statistical evaluation must be based on non-parametric statistics. In audio testing this occurs sometimes in the mid section of the scale, and especially when listeners have to decide which of two artifacts are worse (e.g. distortion versus audio bandwidth). The size of the listening panel depends on the expertise of the listeners and the difficulty of the task: In general, 20 listeners (after post-screening) are considered to be sufficient. Overlapping confidence intervals indicate that either the differences between systems are small or the number of listeners is not sufficient to discriminate between them. The example given in Figure 2 shows that here more listeners would have been necessary.
Test Setup
The test panel consisted of 9 subjects, 5 female and 4 male, aged 21 to 39 years (average 26). The audio items
were played back from a PC using a digital I/O card with external DA converters and using STAX Lambda Pro headphones.
Note: The original listening tests for the AES CD have been conducted with only 9 listeners.
In 2001 the post-screening process was not yet defined. Revisiting the results we found that the data of
several of the listeners had to be rejected with today's criteria, which produces the results listed below.
Test Results
This section lists available scores with the associated audio material where available. The links "detailed results" shows plots of the results of the statistical analysis with today's post screening criteria. In the text, the results have been rounded to full numbers.
Pre-Echo
MUSHRA Results: detailed results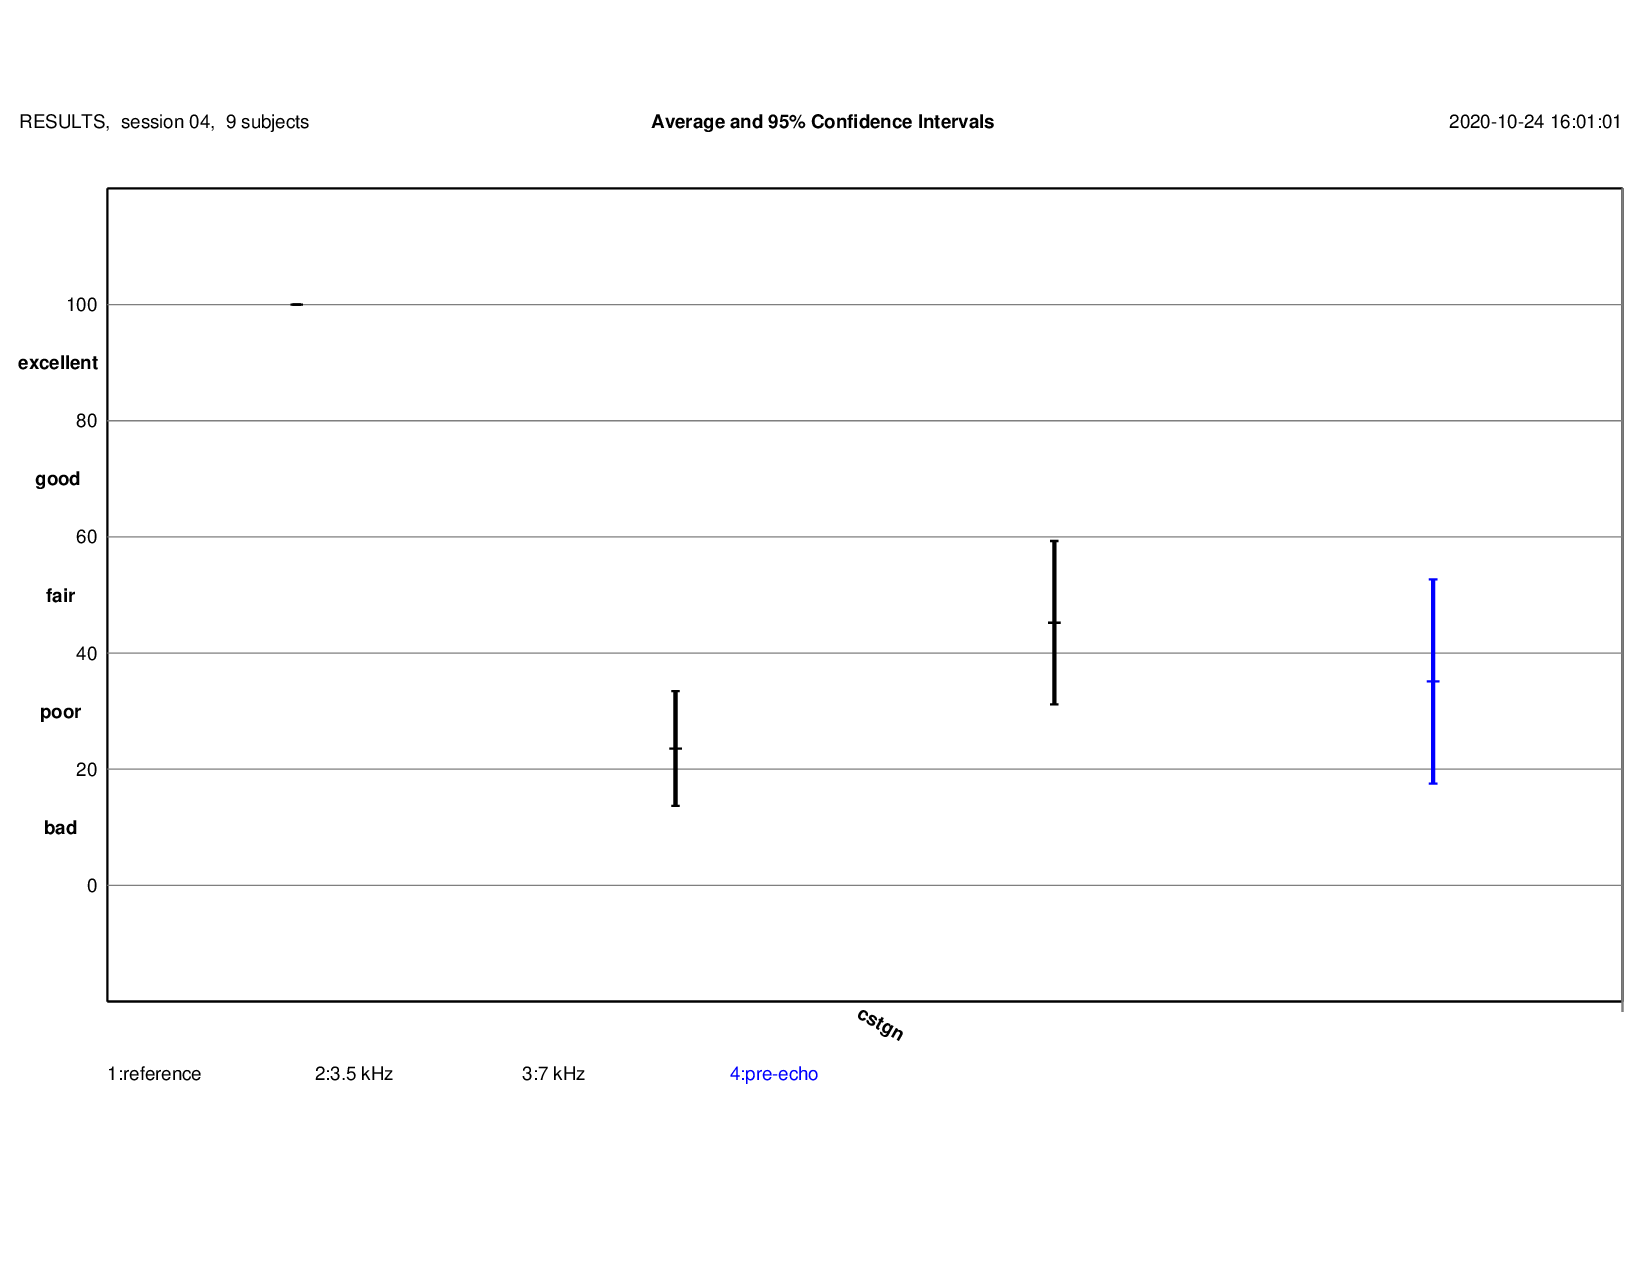
Birdies / Band Limitation
MUSHRA Results: detailed results (for Funky and Glockenspiel)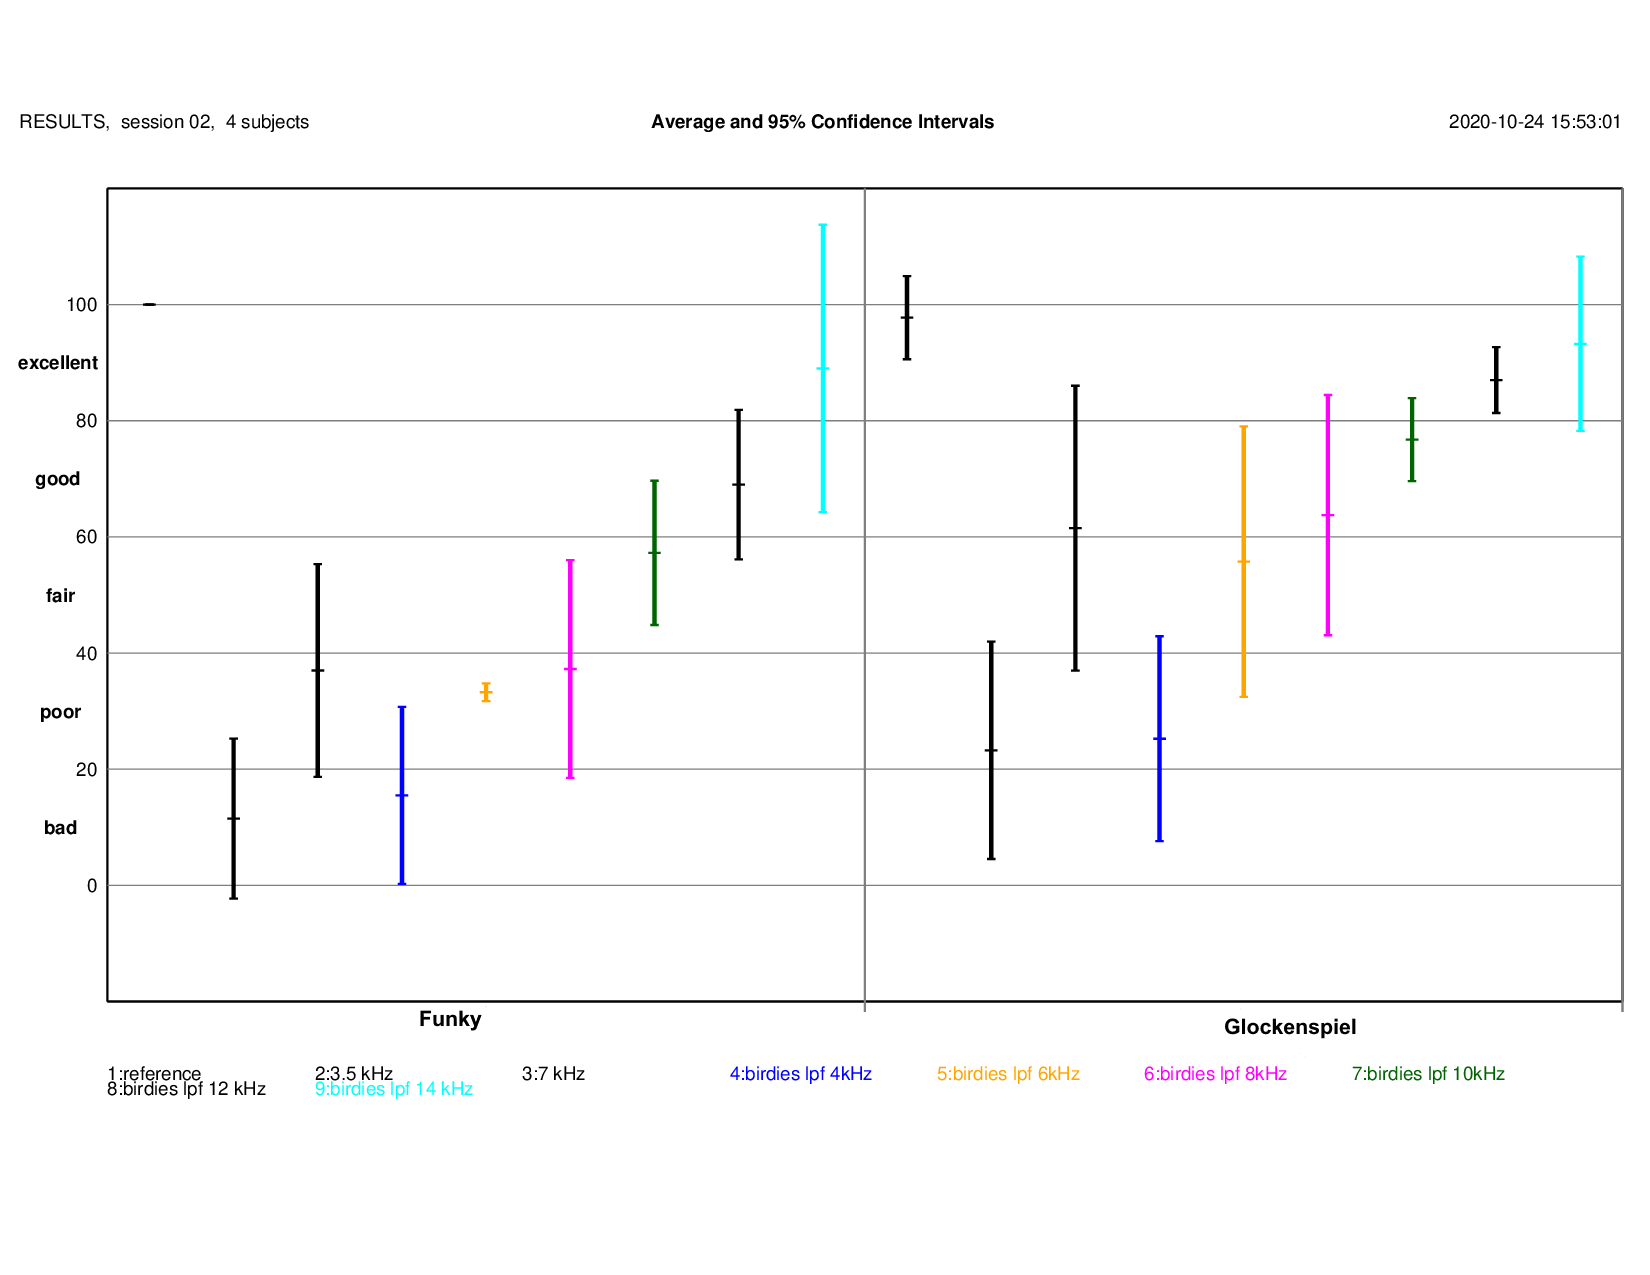
Note: additional conditions in listening test
Gilmour
Gilmour: detailed results Play Original (mean score: 100) Play Slightly distorted decoded signal (mean score: 48) Play Clearly distorted decoded signal (mean score: 36) Play Severely distorted decoded signal (mean score: 23) Play 8 kHz low pass filtered original (mean score: 69) Play Almost birdies free (mean score: 62) Play Slightly distorted decoded signal (mean score: 48) Play Severely distorted decoded signal (mean score: 34)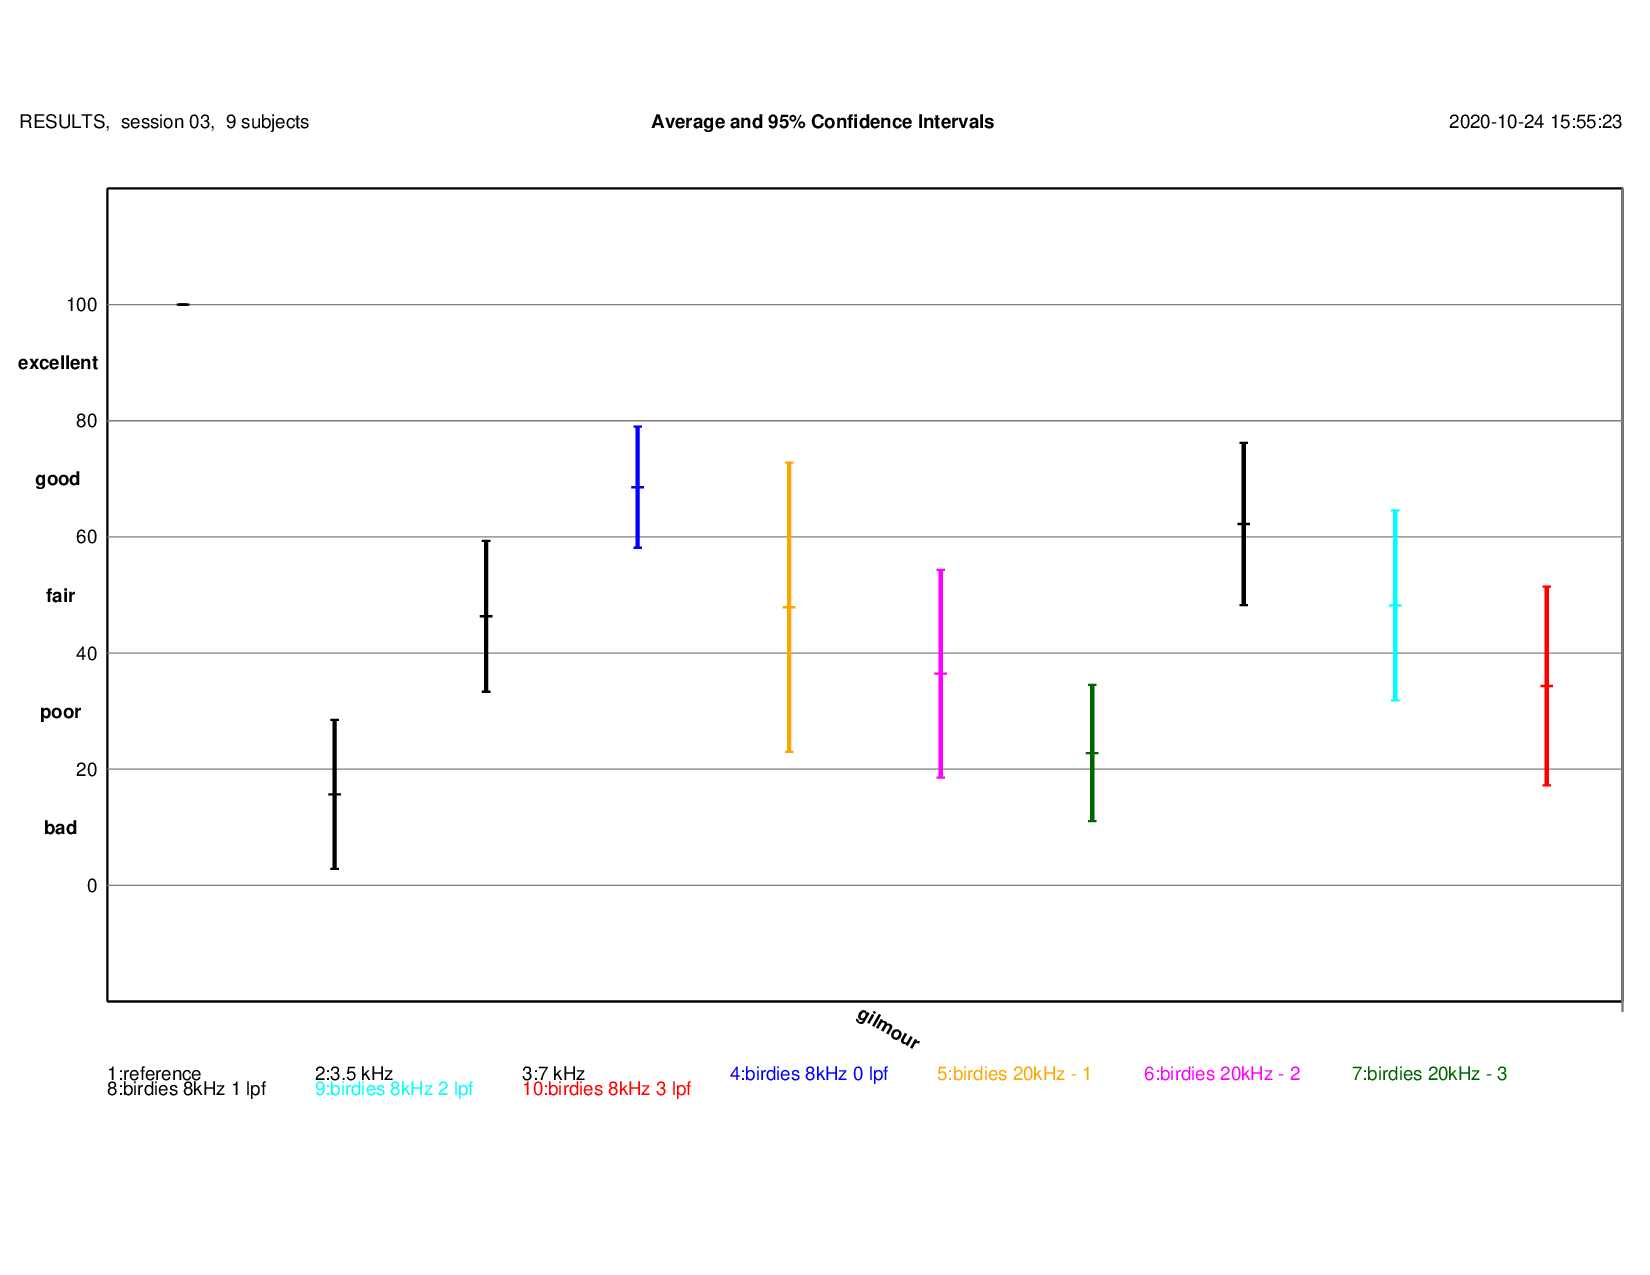
Speech Reverberation
MUSHRA Results: detailed results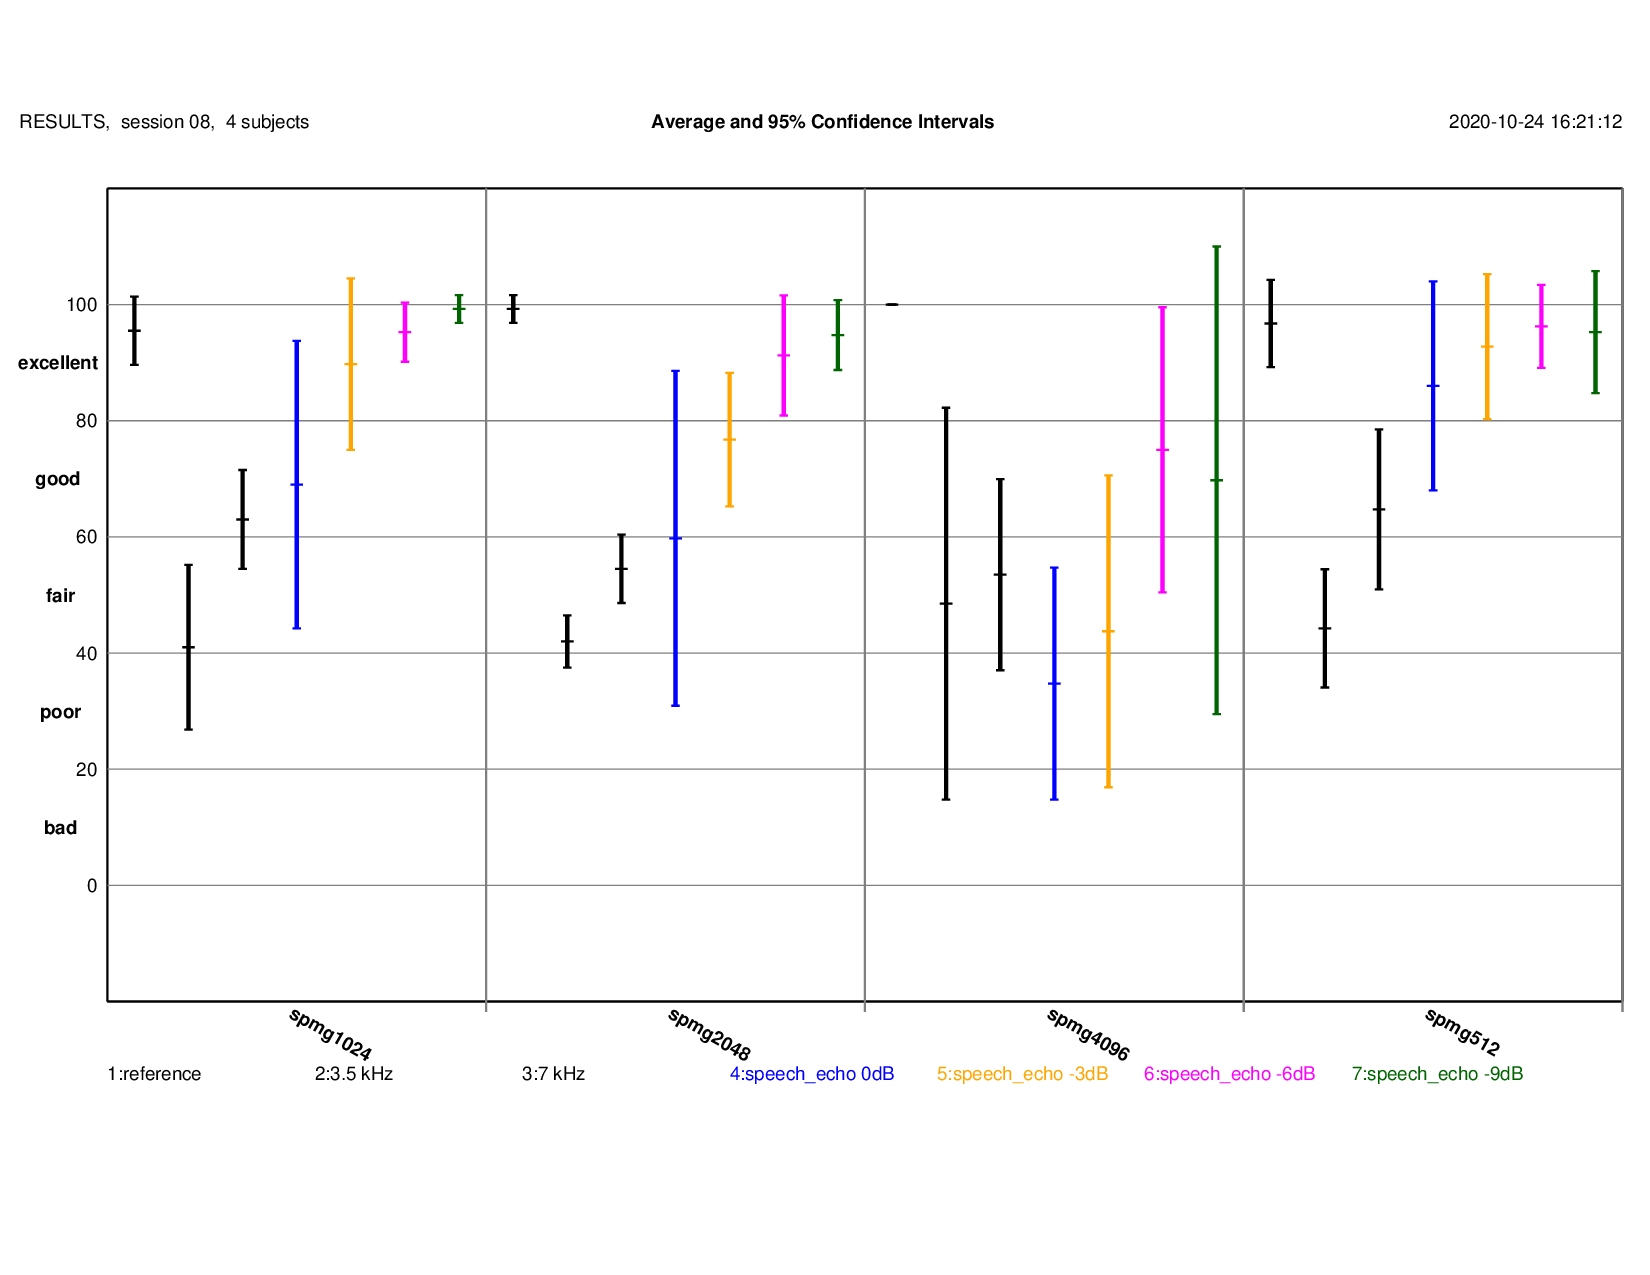
Note: score for the reference is context dependent!
Male Speech
Play Original (mean score: 96-100) Play 4096 samples 0dB (mean score: 35) Play 4096 samples -3dB (mean score: 44) Play 4096 samples -6dB (mean score: 75) Play 4096 samples -9dB (mean score: 70) Play 2028 samples 0dB (mean score: 60) Play 2028 samples -3dB (mean score: 77) Play 2048 samples -6dB (mean score: 91) Play 2048 samples -9dB (mean score: 95) Play 1024 samples 0dB (mean score: 69) Play 1024 samples -3dB (mean score: 90) Play 1024 samples -6dB (mean score: 95) Play 1024 samples -9dB (mean score: 99) Play 512 samples 0dB (mean score: 86) Play 512 samples -3dB (mean score: 93) Play 512 samples -6dB (mean score: 96) Play 512 samples -9dB (mean score: 95)Stereo Imaging
MUSHRA Results: detailed results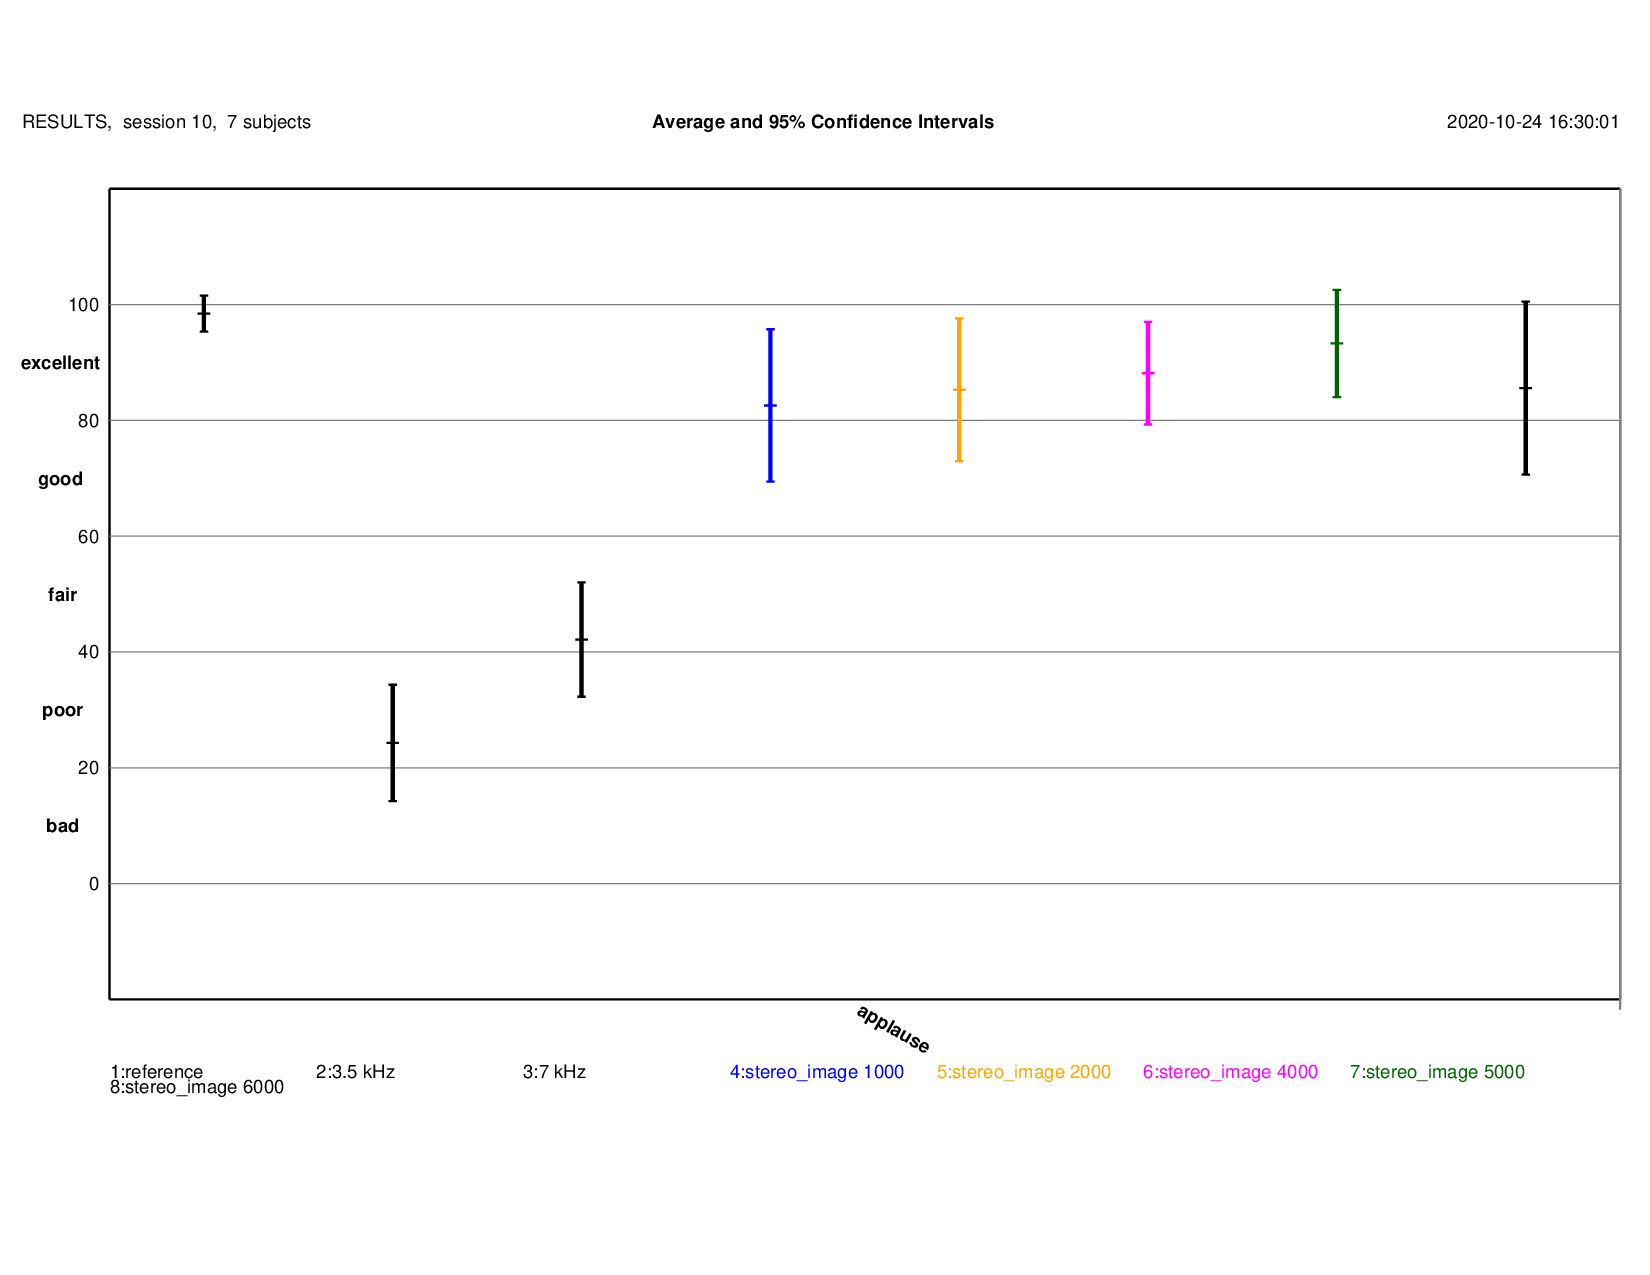
Note: overlapping confidence intervals!
Tandem Coding
MUSHRA Results: detailed results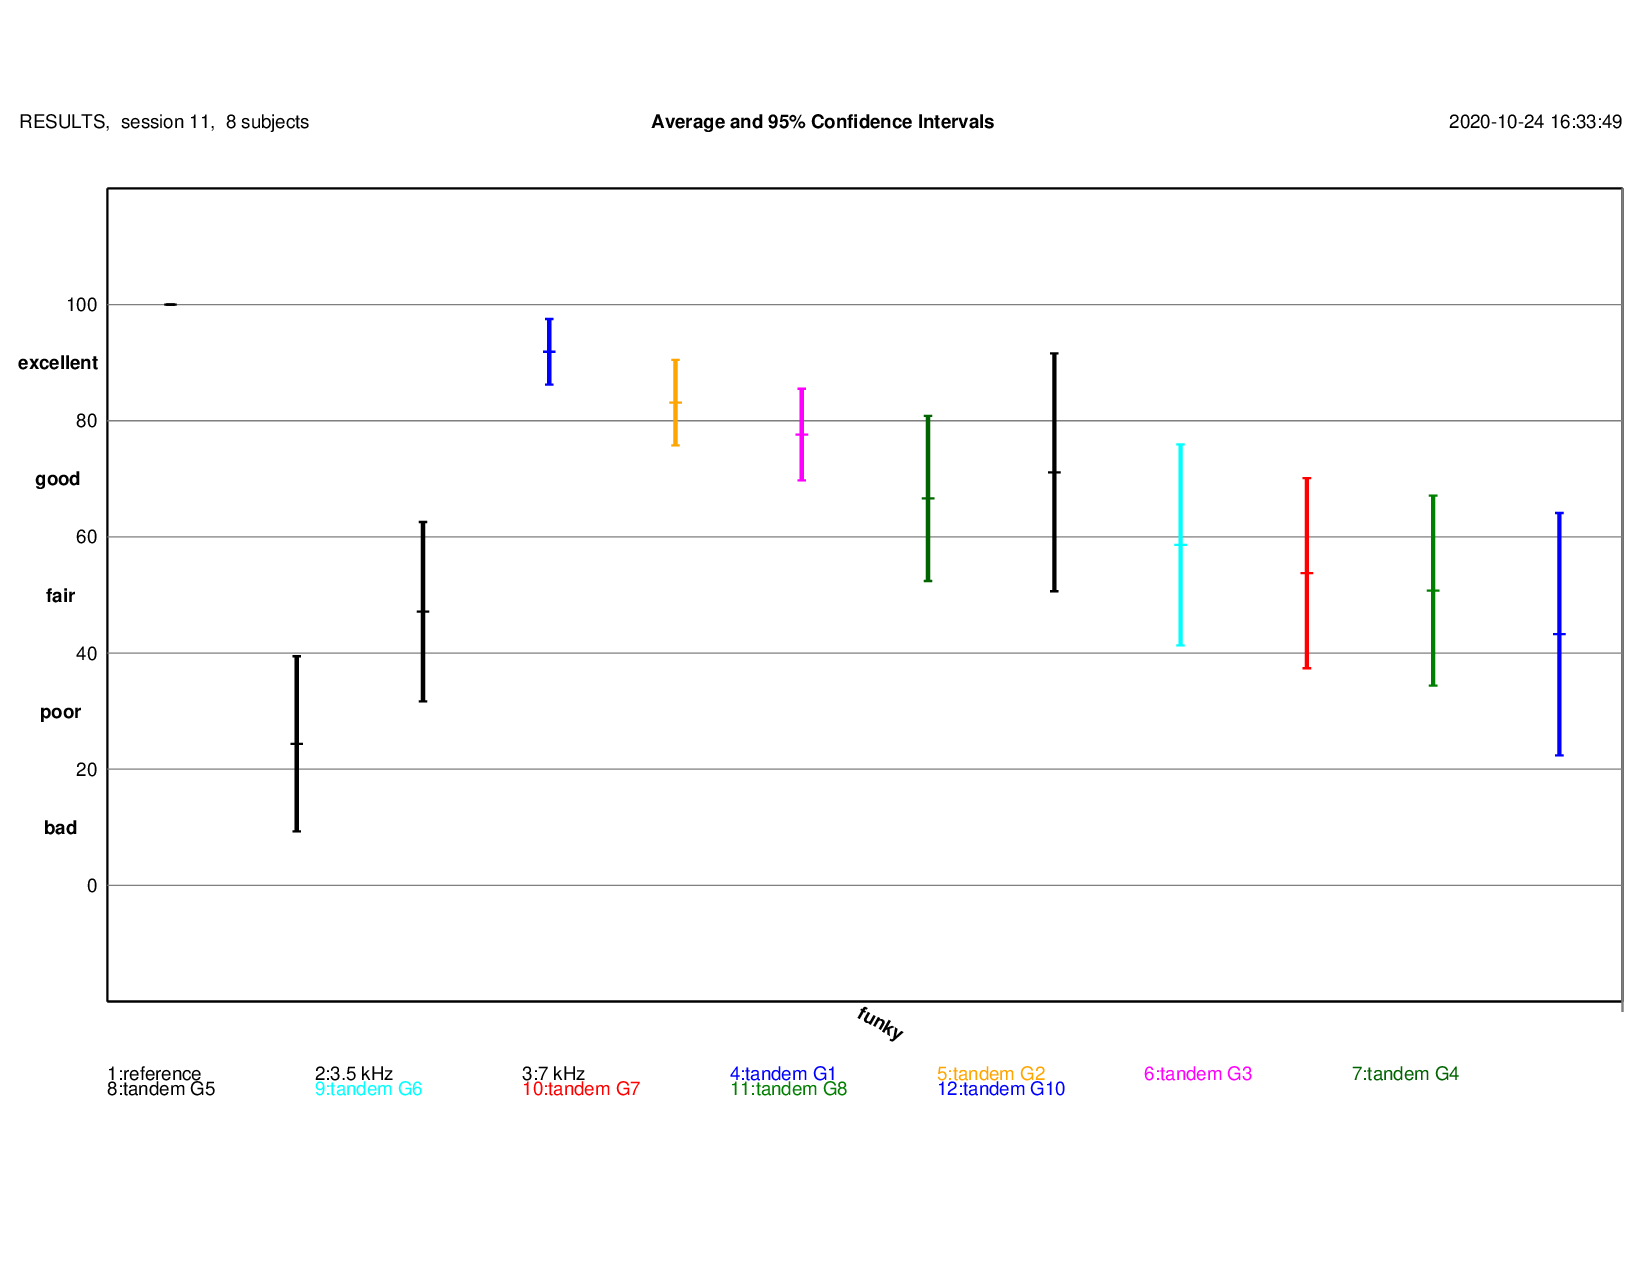
Note: generation #9 not evaluated in the listening test
Funky
Play Original (mean score: 100) Playgeneration #1 (mean score: 92) Playgeneration #2 (mean score: 83) Playgeneration #3 (mean score: 78) Playgeneration #4 (mean score: 67) Playgeneration #5 (mean score: 71) Playgeneration #6 (mean score: 59) Playgeneration #7 (mean score: 54) Playgeneration #8 (mean score: 51) Playgeneration #10 (mean score: 43)Speech Coding
MUSHRA Results: detailed results(for male, female, quartet and gilmour)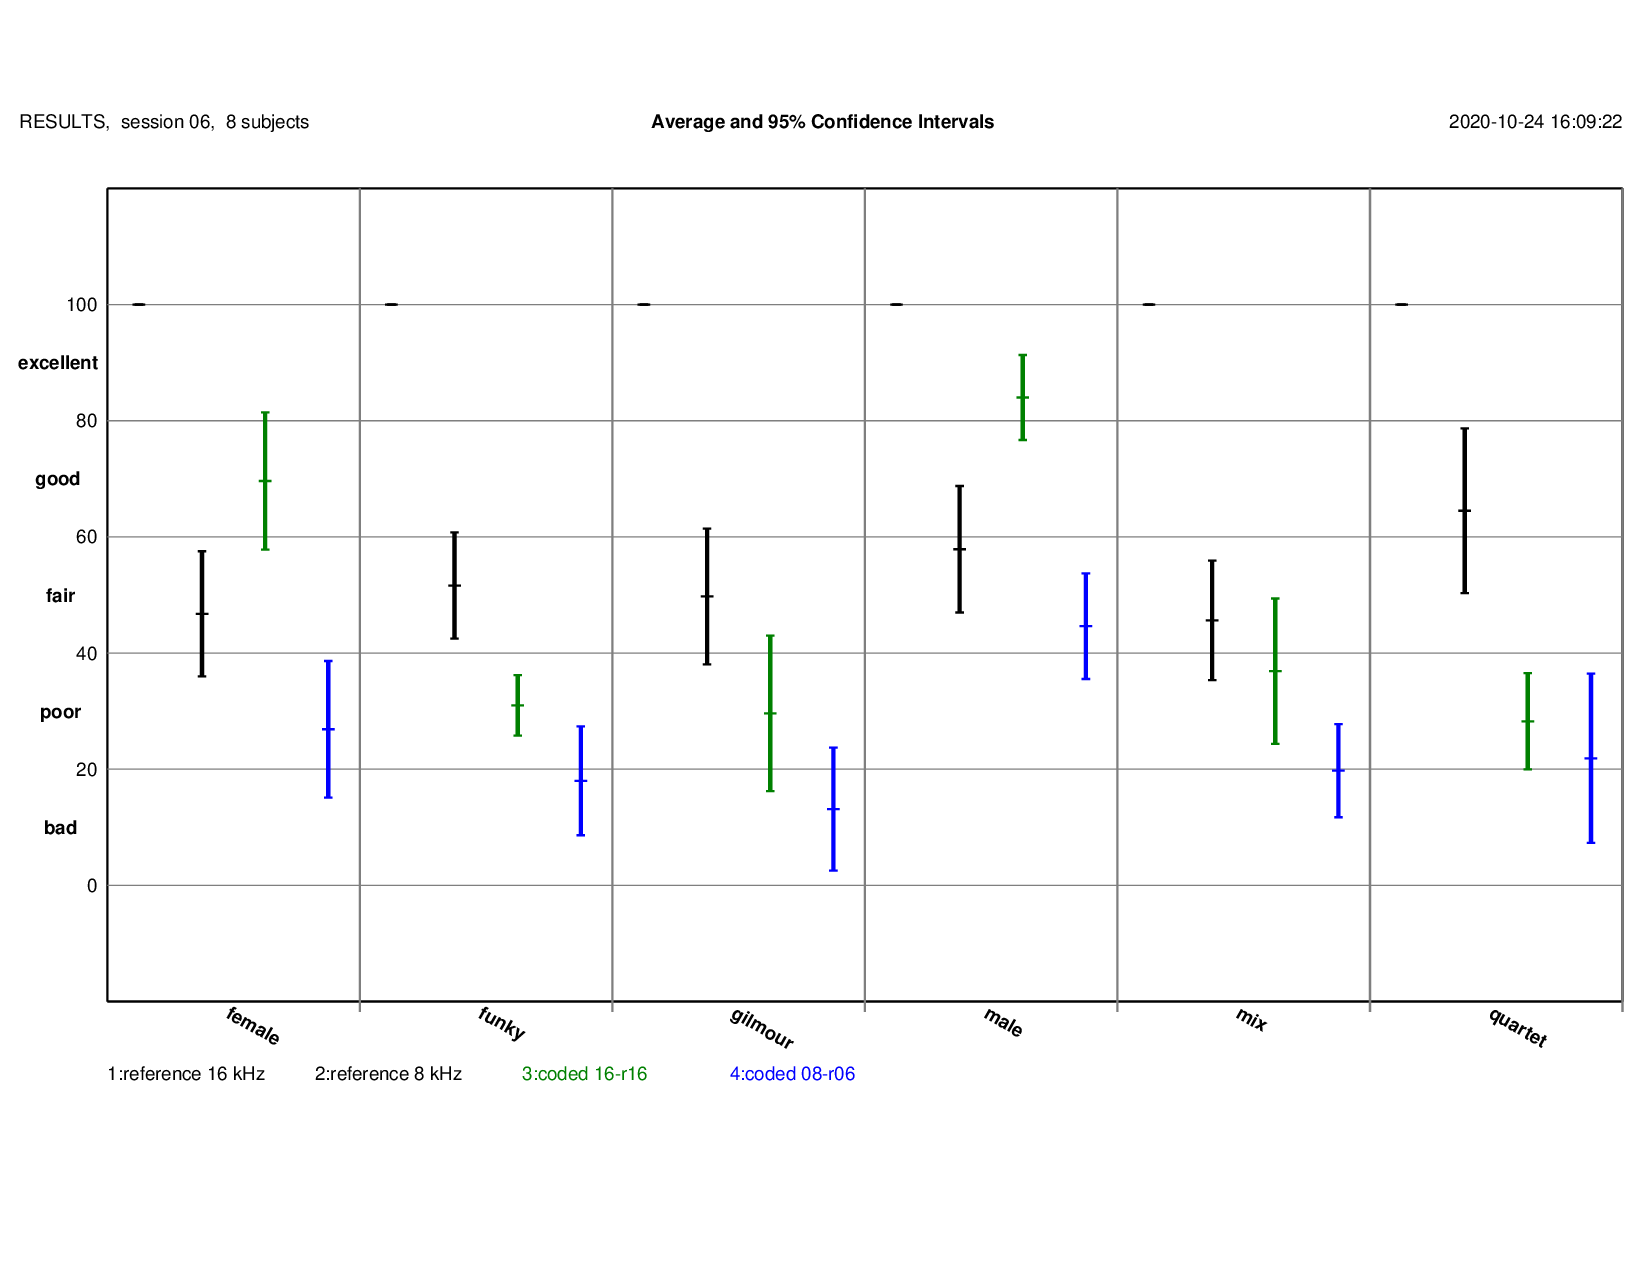
Note 1: additional items in listening test
Note 2: 16kHz used as reference, 8kHz used as hidden anchors, no additional hidden anchor used.
References
[1] ITU-R SG6: Recommendation ITU-R BS.1534-3: Method for the subjective assessment of intermediate quality of audio systems. 10/2015